Spatial Transcriptomics: Applications, Methods, & Challenges
What is spatial transcriptomics?
The goal of spatial transcriptomics is to measure gene expression (i.e. quantify mRNA transcripts) in the spatial context of a tissue sample. Genes, cells, and cell populations operate interdependently, modulating their behaviors based on many environmental factors. Spatial patterning is a crucial aspect of gene regulation that is impossible to discern through methods that involve homogenizing tissue samples.
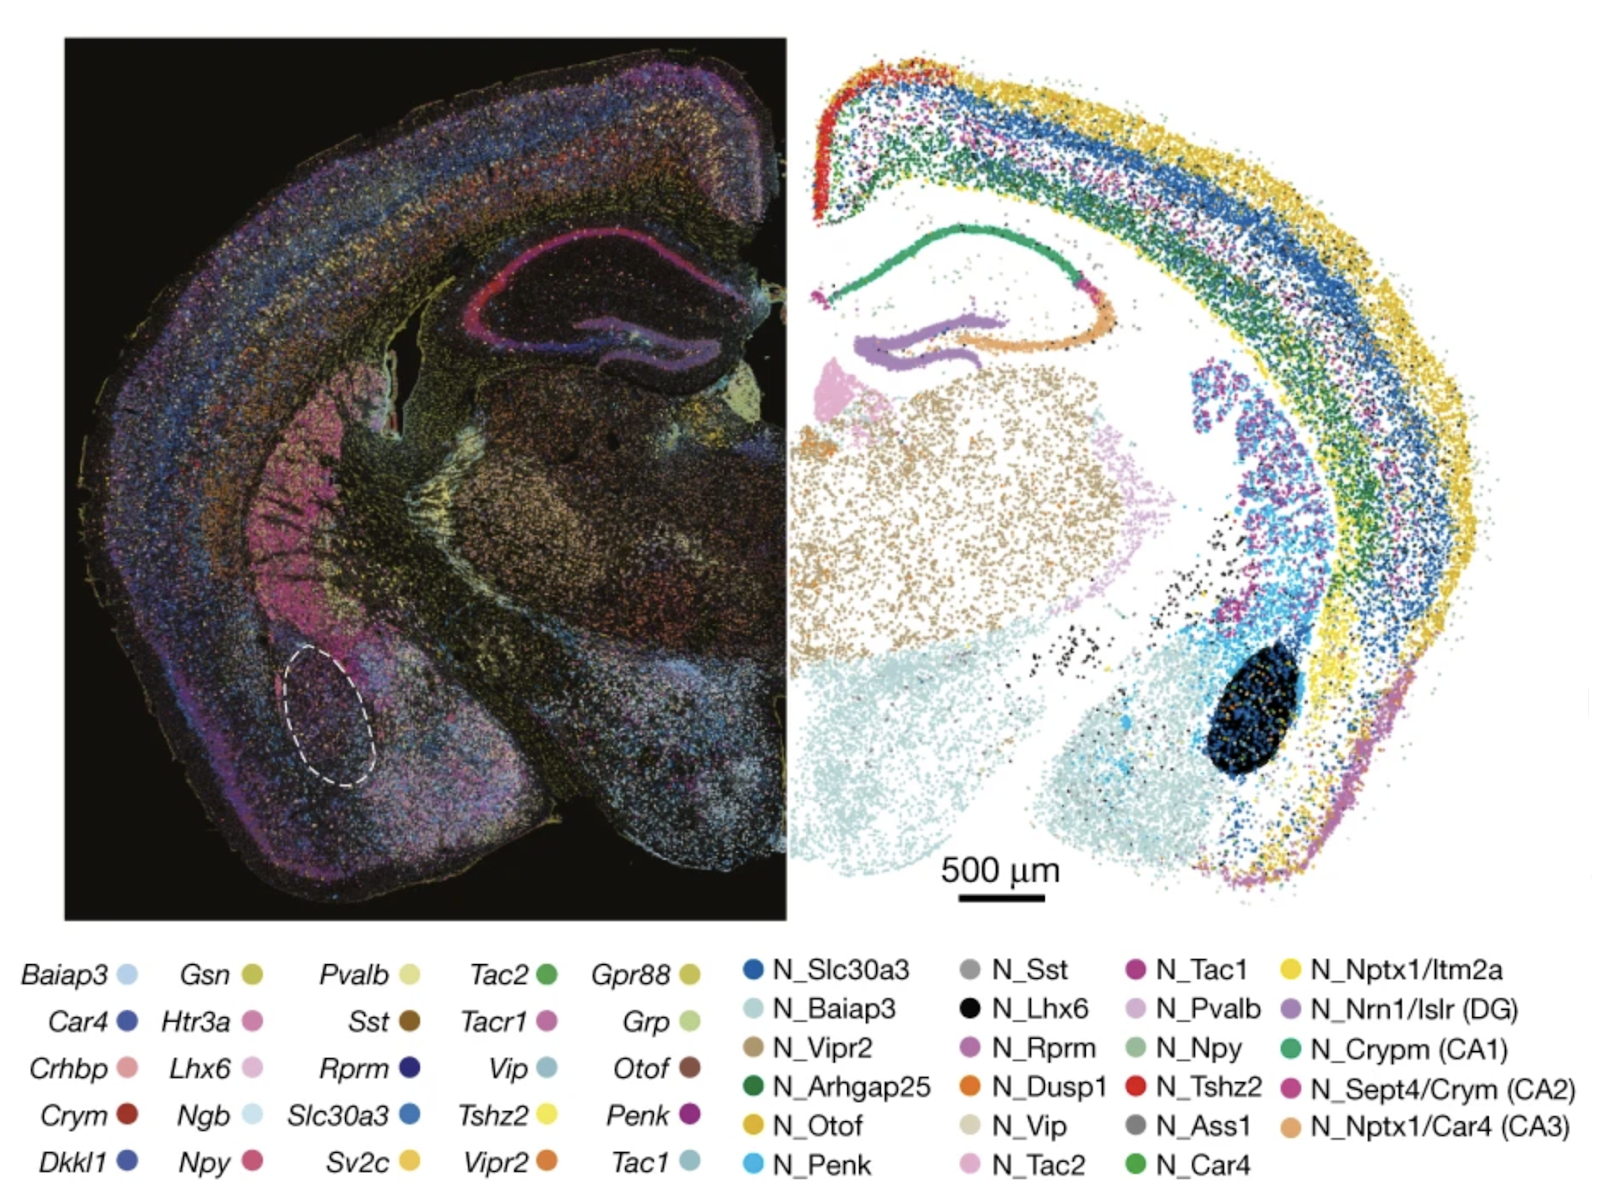
Neuronal gene expression (left, italicized) and cell-type annotations (right, non-italicized) spatially resolved in a section of a mouse brain. From Sun et al., “Spatial transcriptomics reveal neuron–astrocyte synergy in long-term memory,” Nature (2024).
What does spatial transcriptomics have to do with precision medicine?
Many biological processes are orchestrated by “neighborhoods” or subpopulations of cells interacting with their environment, which may include proteins, molecules, other cells, and so on. Being able to characterize these interactions and microenvironments in space has many applications in basic biomedical research, therapeutics, and diagnostics. Here are a few examples of how spatial transcriptomics has illuminated processes in major biomedical research areas:
- Cancer: Tumor behavior is deeply influenced by relationships to neighboring molecules, vasculature, and cells: a suite of characteristics known as the tumor microenvironment. A recent study by Chia-Kuei Mo et al. uses spatial transcriptomics to pinpoint tumor regions called “spatial subclones” with similar structural, environmental, and genetic features. The authors identify oncogenic characteristics shared by each subclone, including T-cell and macrophage infiltration, immune activity, and antigen presentation, painting a detailed picture in both 2- and 3-D of how tumors evolve based on their microenvironment.
- Neuroscience: The human nervous system is composed of several cell types, including neurons, astrocytes, and microglia. Spatiotemporal interactions between these cell types are involved in critical neural processes such as coordinating neural activity, regulating neurotransmitters, and preventing or promoting neurodegeneration. In a 2024 study by Wenfei Sun et al., spatial and single-cell transcriptomics analyses showed subpopulations of interacting neurons and astrocytes associated with the formation and preservation of long-term memories. Untangling the cellular and molecular underpinnings of memory formation is not only fundamental to our understanding of the brain, but also to improving prognosis for neurodegenerative conditions like Alzheimer’s disease.
- Cardiovascular disease: Advances in basic and clinical research have significantly extended and improved the lives of people who experience devastating events like myocardial infarction (heart attacks). In a 2022 study, Christoph Kuppe et al. used single-cell spatial transcriptomics to create a high-resolution cellular and molecular map of how cardiac tissue changes during myocardial infarction. The authors identified disease-specific transcriptomic, epigenomic, and cell-type composition changes, as well as spatial dependencies on neighboring cells. Data like these will be invaluable for developing cell- and drug-based interventions to prevent or treat cardiac conditions, as well as provide important context for biomechanical interventions like surgery.
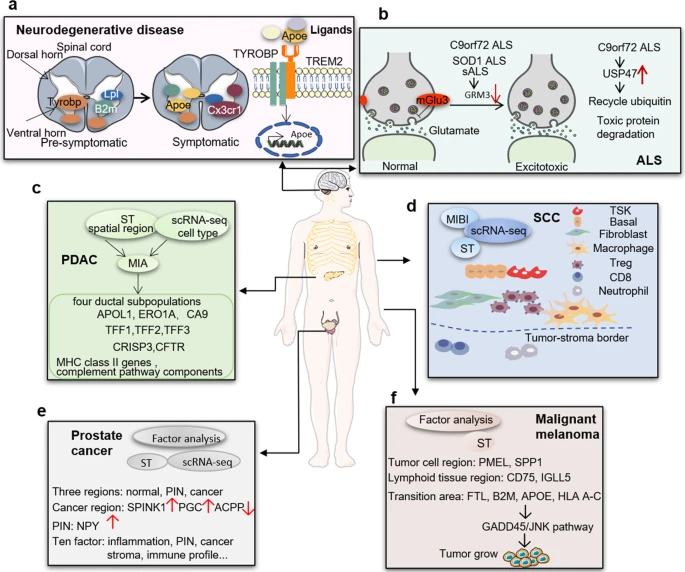
Examples of applications of spatial transcriptomics in a) neurodegenerative disease, b) amyotrophic lateral sclerosis, c) pancreatic ductal adenocarcinoma, d) squamous cell carcinoma, e) prostate cancer, and f) malignant melanoma. From Zhang et al., “Clinical and translational values of spatial transcriptomics,” Sig Transduct Target Ther (2022).
How were spatial transcriptomics technologies first developed?
Approaches like the ones highlighted above build upon a long heritage of research aiming to visualize gene expression in space, which can be traced back to the 1970s with the first in situ hybridization technologies. More recently, the development of single-cell RNA-seq (or scRNA-seq) significantly improved the resolution at which researchers could obtain transcriptomic data. While scRNA-seq itself does not provide spatial information, advances in this technology were a crucial step toward developing throughput single-cell spatial transcriptomics.
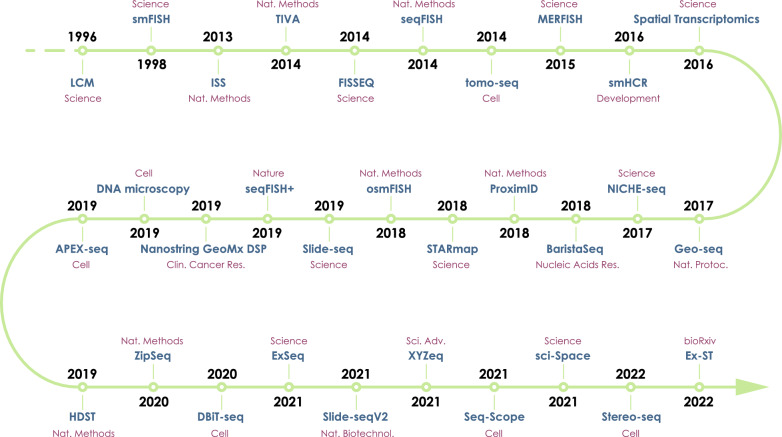
The first paper using the phrase “spatial transcriptomics” was published in 2016 in Science by Dr. Patrik L. Ståhl et al., who introduced a method of location-based barcoding to add a layer of spatial information to RNA sequencing data. While not using the same terminology, there are earlier methods that also captured both spatial and gene expression data, such as MERFISH (Chen et al., Science 2015).
What are the major methods used for spatial transcriptomics now, and how do they compare to each other?
Barcoded RNA Sequencing: Visium
In the original “spatial transcriptomics” paper from 2016, Ståhl et al. demonstrated a way of retaining spatial information from cells during RNA sequencing using a barcoding technique, which has since been commercialized into 10X Genomics’ Visium platform. The authors essentially placed 2D histological tissue sections on an array of reverse transcription primers containing barcodes unique to their position in the array. RNA sequencing data from these sections thus reveal distinct barcodes, identifying their location in the sample.
This method poses a groundbreaking way of adding a spatial dimension to RNA sequencing, however the resolution of the resulting data is relatively poor. Rather than sampling one cell at a time, each sample is more likely a grouping of 2-10 cells. Interpreting results from collections of multiple cells is difficult, and necessitates a complicated deconvolution step in order to distinguish individual cells.

Multiplexed Fluorescent Labeling: MERFISH
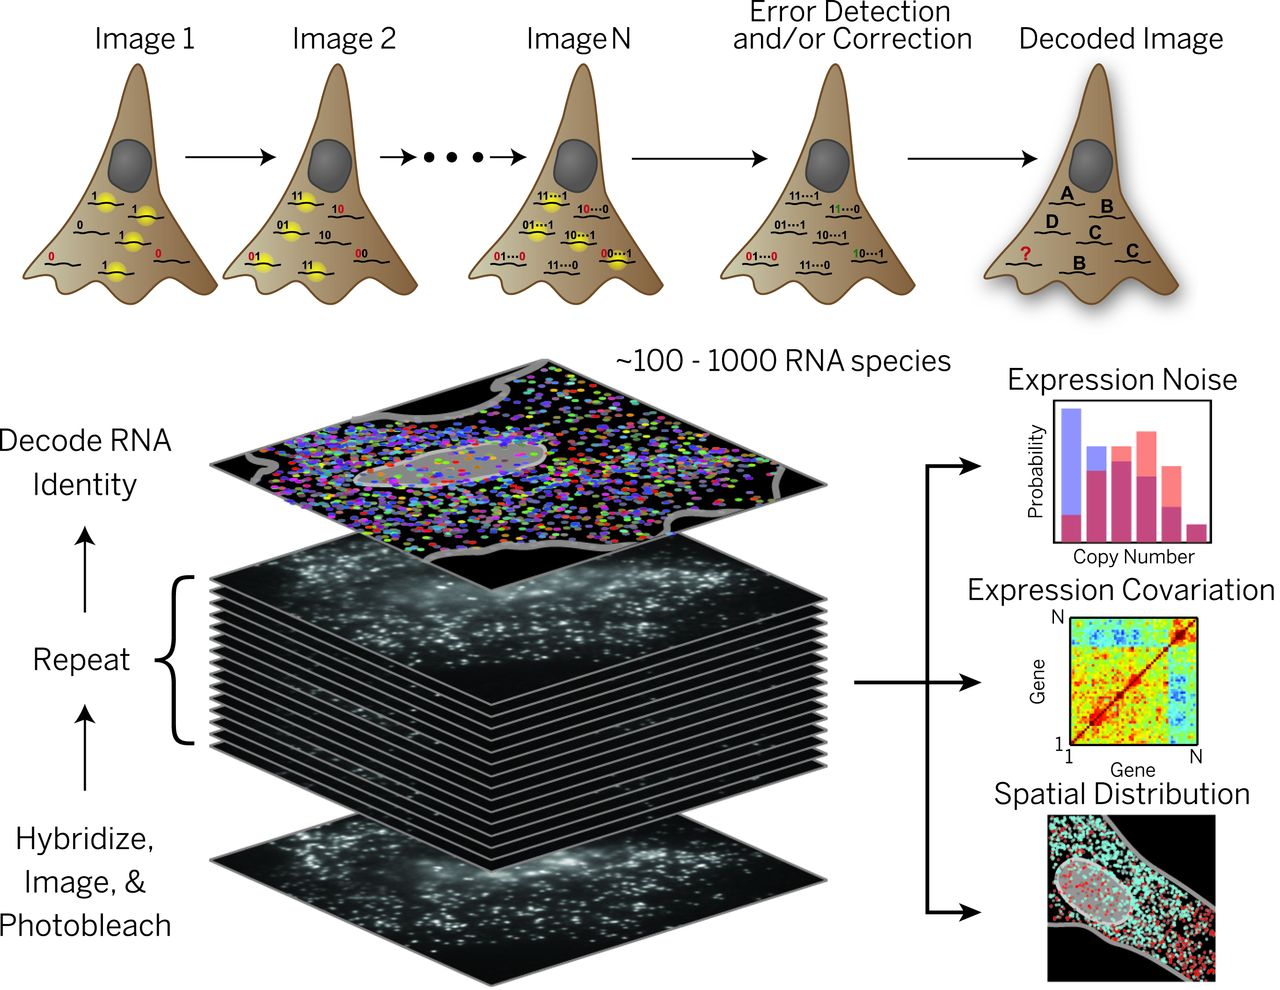
In 2015, Dr. Kok Hao Chen et al. introduced a method of obtaining spatial gene expression data via multiplexed, error-robust fluorescent in situ hybridization: MERFISH. MERFISH involves multi-round labeling of mRNA transcripts with different fluorophores, allowing for detection and discernment of individual transcripts for different genes at single-cell resolution. While this avoids the resolution problem encountered in the sequencing approach, MERFISH data show relatively few gene transcripts per sample, limited by the available fluorophores and the staining process.
The major challenge of analyzing MERFISH data comes from transforming image data into quantifiable data. This involves accurately and robustly identifying individual cells in microscopy images through a process called cell segmentation. Cell segmentation is computationally difficult and resource-intensive, requiring GPU acceleration to even be feasible, let alone effective.
High-Throughput, Expanded MERFISH: Xenium
An emerging spatial transcriptomics method is 10X Genomics’ Xenium platform, which builds on the fundamentals of the MERFISH system but significantly increases the throughput, allowing for labeling and imaging of up to 5000 genes per sample. This method essentially requires specialized proprietary equipment.
What are the biggest overall challenges in interpreting spatial transcriptomics data?
All of these technique-specific challenges arise from the same fundamental issue: we need to accurately identify sub-populations of cell types and sub-types, and discern which ones are actually interacting. Here are a few key analysis hurdles that need to be overcome in order to address these interpretation problems:
- Standardization: Because this is such a new research area, there aren’t really standardized best practices for data processing and interpretation yet. One attempt to address this standardization problem is scverse’s Squidpy package: a tool for analyzing and visualizing spatial single-cell data with Python. Another is the Seurat R package, an R-oriented toolkit for single-cell analysis that can also be utilized for spatial data and is maintained by Dr. Rahul Satija’s lab.
- Resolution: Researchers often struggle with low cellular resolution and limited transcript coverage. Attempts at addressing these technical barriers include for example figuring out how to accurately integrate spatial data with scRNA-seq data in order to improve resolution and attribute expression to individual cells.
- Alignment: Spatial atlases constructed from multiple images are a useful tool for comparing and building upon data across research efforts. Developing these atlases, however, requires resolving discrepancies in image and sequencing resolution, as well as inherent biological variation.
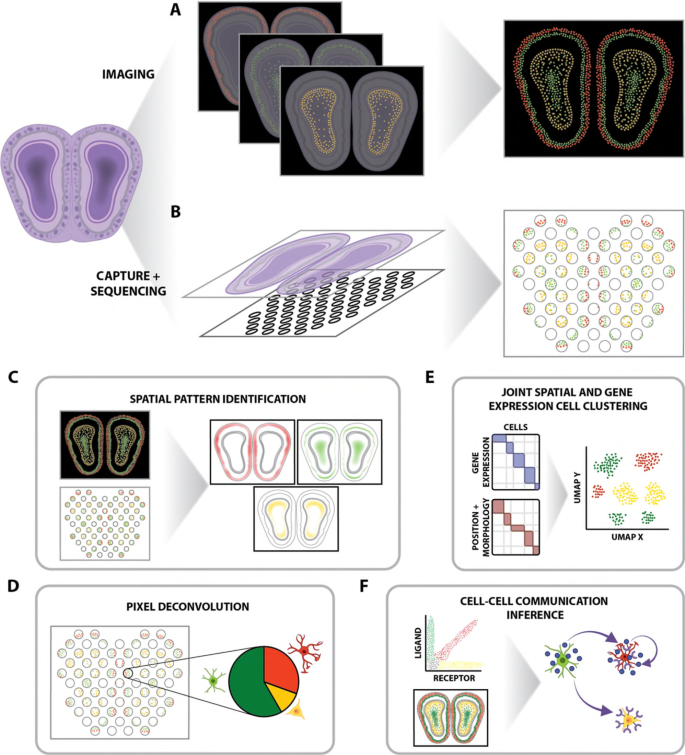
How do we overcome these challenges?
While these approaches are promising, they are prohibitively resource-intensive using only CPUs. For example, performing cell segmentation in this example dataset took 3.5 hours with a CPU, and just 12 minutes with GPU acceleration. These discrepancies scale quickly with increasing size of datasets and complexity of tasks. However, there are still many barriers to accessing GPU-based computational power for biological applications. That’s why Watershed is pioneering GPU-enabled biocomputing, expanding access to GPU resources for the life sciences. The Watershed platform is the modern bioinformatics operating system, providing the compute power necessary to rapidly execute complex algorithms, derive meaningful insights from imaging data, and more.
Furthermore, while many groups are actively developing and publishing new analysis methods for spatial transcriptomics data, many of these tools are difficult to access and implement. Bioinformaticians often have to wait for pre-built managed workflows to exist in order to integrate the latest methods into their own research. The Watershed platform offers unrestricted, install-and-go access to open-source coding tools, allowing bioinformaticians to take advantage of the latest methods right away.
Learn more and test drive the platform for yourself by scheduling a demo or contacting us at contact@watershed.bio.
